Monitoring
Firehose provides a detailed health dashboard (Grafana) for effortless monitoring. Always know what’s going on with your deployment with built-in monitoring of throughput, response times, errors and more.
The Firehose Grafana dashboard provides detailed visualization of all Firehose metrics. For further details on each metric, please refer the Metrics section.
Flow of Metrics from Firehose to Grafana
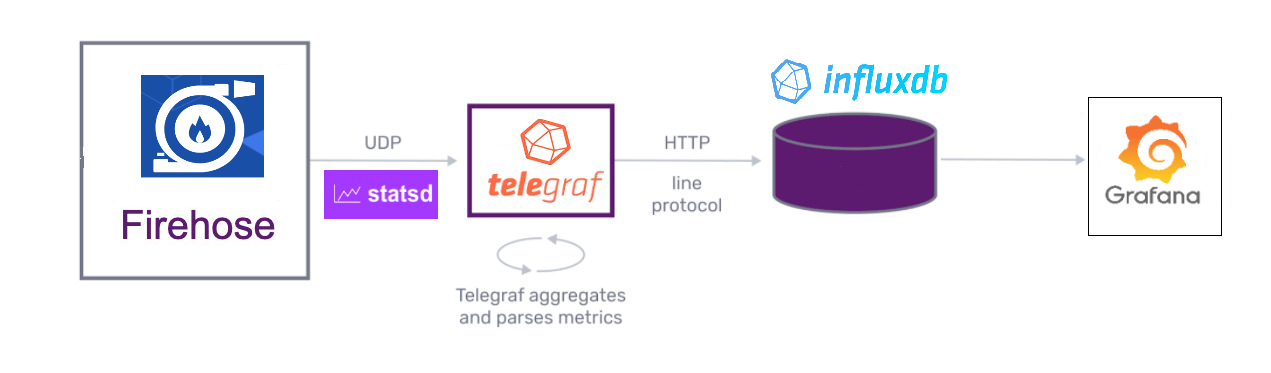
StatsD Client
StatsD is a simple protocol for sending application metrics via UDP. StatsD is simple and has a tiny footprint. It can’t crash your application and has become the standard for large-scale metric collection. Firehose uses the StatsD client library to send metrics to the Telegraf StatsD host.
Telegraf
Telegraf is an agent written in Go and accepts StatsD protocol metrics over UDP. It works as a metrics aggregator and then periodically flushes the metrics to InfluxDB database. Telegraf is deployed in a container along with Firehose container in the Kubernetes pod.
InfluxDB
InfluxDB is a time-series database where all Firehose metrics are stored. It accepts metrics flushed from the Telegraf agent. InfluxDB stores the metrics along with corresponding metric tags, e.g. - SUCCESS_TAG , FAILURE_TAG InfluxDB is deployed on a separate Kubernetes cluster.
Grafana
Grafana is a multi-platform open-source analytics and interactive visualization web app. It pulls metrics data from the InfluxDB database and provides detailed visualization of all Firehose metrics in real-time. Metrics visualization can be obtained for all or specific pods.
Setting Up Grafana with Firehose
Set Up Grafana service
Create a Grafana Cloud account, to set up Grafana metrics dashboard on the cloud, or download Grafana to set up Grafana dashboard locally. Grafana can also be deployed on Docker by pulling InfluxDB image from DockerHub.
$ docker pull grafana/grafana
Grafana server runs on localhost:3000 by default. Make sure to add your InfluxDB server as the data source in Grafana Data Sources section.
If your using InfluxDB version 1.8 or earlier, then Grafana dashboard can be loaded on your Grafana cloud account or local Grafana server by importing the JSON file firehose-grafana-dashboard-updated.json in the docs/assets/ directory of the Firehose.
Make sure to select InfluxQL as the query language while configuring the InfluxDB as the Grafana data source, since the InfluxDB queries for the Firehose metrics in the firehose-grafana-dashboard-updated.json currently support only InfluxDB 1.x. Then provide the InfluxDB login credentials and other parameters like organization name and bucket name.
Set Up InfluxDB Server
Follow this guide to set up and link your InfluxDB database with Grafana. InfluxDB can be installed locally or can be set up on the cloud via InfluxDB Cloud. For local setup, InfluxDB installer can be downloaded from here. InfluxDB can also be deployed on Docker by pulling InfluxDB image from DockerHub. The following command will pull the InfluxDb 2.x latest version.
$ docker pull influxdb
For compatibity with the sample Firehose Grafana dashboard (which current only supports InfluxQL query language), you must download and install InfluxDB 1.x . To deploy InfluxDB 1.x on Docker, run the following to pull the image from Docker Hub.
$ docker pull influxdb:1.8
Make sure to add the InfluxDB server URLs, port and the login credentials to the telegraf.conf file. By default, InfluxDB server is hosted on localhost:8086 . Create a new bucket for the Firehose metrics and configure the bucket name in the telegraf.conf file, as well as in the InfluxDB source properties in the Grafana Data Sources section
The Telegraf output plugin configuration for InfluxDB v2 + can be found here. The Telegraf output plugin configuration for InfluxDB v1.x can be found here.
Set Up Telegraf Server
Lastly, set up Telegraf to send metrics to InfluxDB, following the corresponding instructions according to your Firehose deployment -
Firehose in Docker or deployed locally
- Follow this guide to install and set up Telegraf as the StatsD host. For a sample Telegraf file, needed for Firehose you may refer the
telegraf.conffile indocs/assets/ - Configure the Firehose environment variables
METRIC_STATSD_HOSTandMETRIC_STATSD_PORTto the IP address and port on which Telegraf is listening. By default,METRIC_STATSD_HOSTis set tolocalhostandMETRIC_STATSD_PORTis set to the default listener port of Telegraf, i.e.8125 - In
telegraf.conf, check these 2 configs in INPUT PLUGINS in the StatsD plugin configuration, setdatadog_extensions = trueanddatadog_distributions = true - Configure the URL and port of the InfluxDB server in the Telegraf configuration file, i.e.
~/.telegraf/telegraf.conf
Firehose deployed on Kubernetes **
- Follow this guide for deploying Firehose on a Kubernetes cluster using a Helm chart.
- Configure the following parameters in the default values.yaml file and run -
$ helm install my-release -f values.yaml goto/firehose
| Key | Type | Default | Description |
|---|---|---|---|
| telegraf.config.output.influxdb.database | string | "test-db" | db name for telegraf influxdb output |
| telegraf.config.output.influxdb.enabled | bool | false | flag for enabling telegraf influxdb output |
| telegraf.config.output.influxdb.retention_policy | string | "autogen" | retention policy for telegraf influxdb output |
| telegraf.config.output.influxdb.urls | list | ["http://localhost:8086"] | influxdb urls for telegraf output |
| telegraf.enabled | bool | false | flag for enabling telegraf |
Grafana Dashboard
Grafana is a multi-platform open-source analytics and interactive visualization web application. It provides charts, graphs, and alerts for the web when connected to supported data sources. A licensed Grafana Enterprise version with additional capabilities is also available as a self-hosted installation or an account on the Grafana Labs cloud service.
Grafana dashboard can be loaded on your Grafana cloud account by importing the JSON file firehose-grafana-dashboard-updated.json in the docs/assets/ directory.
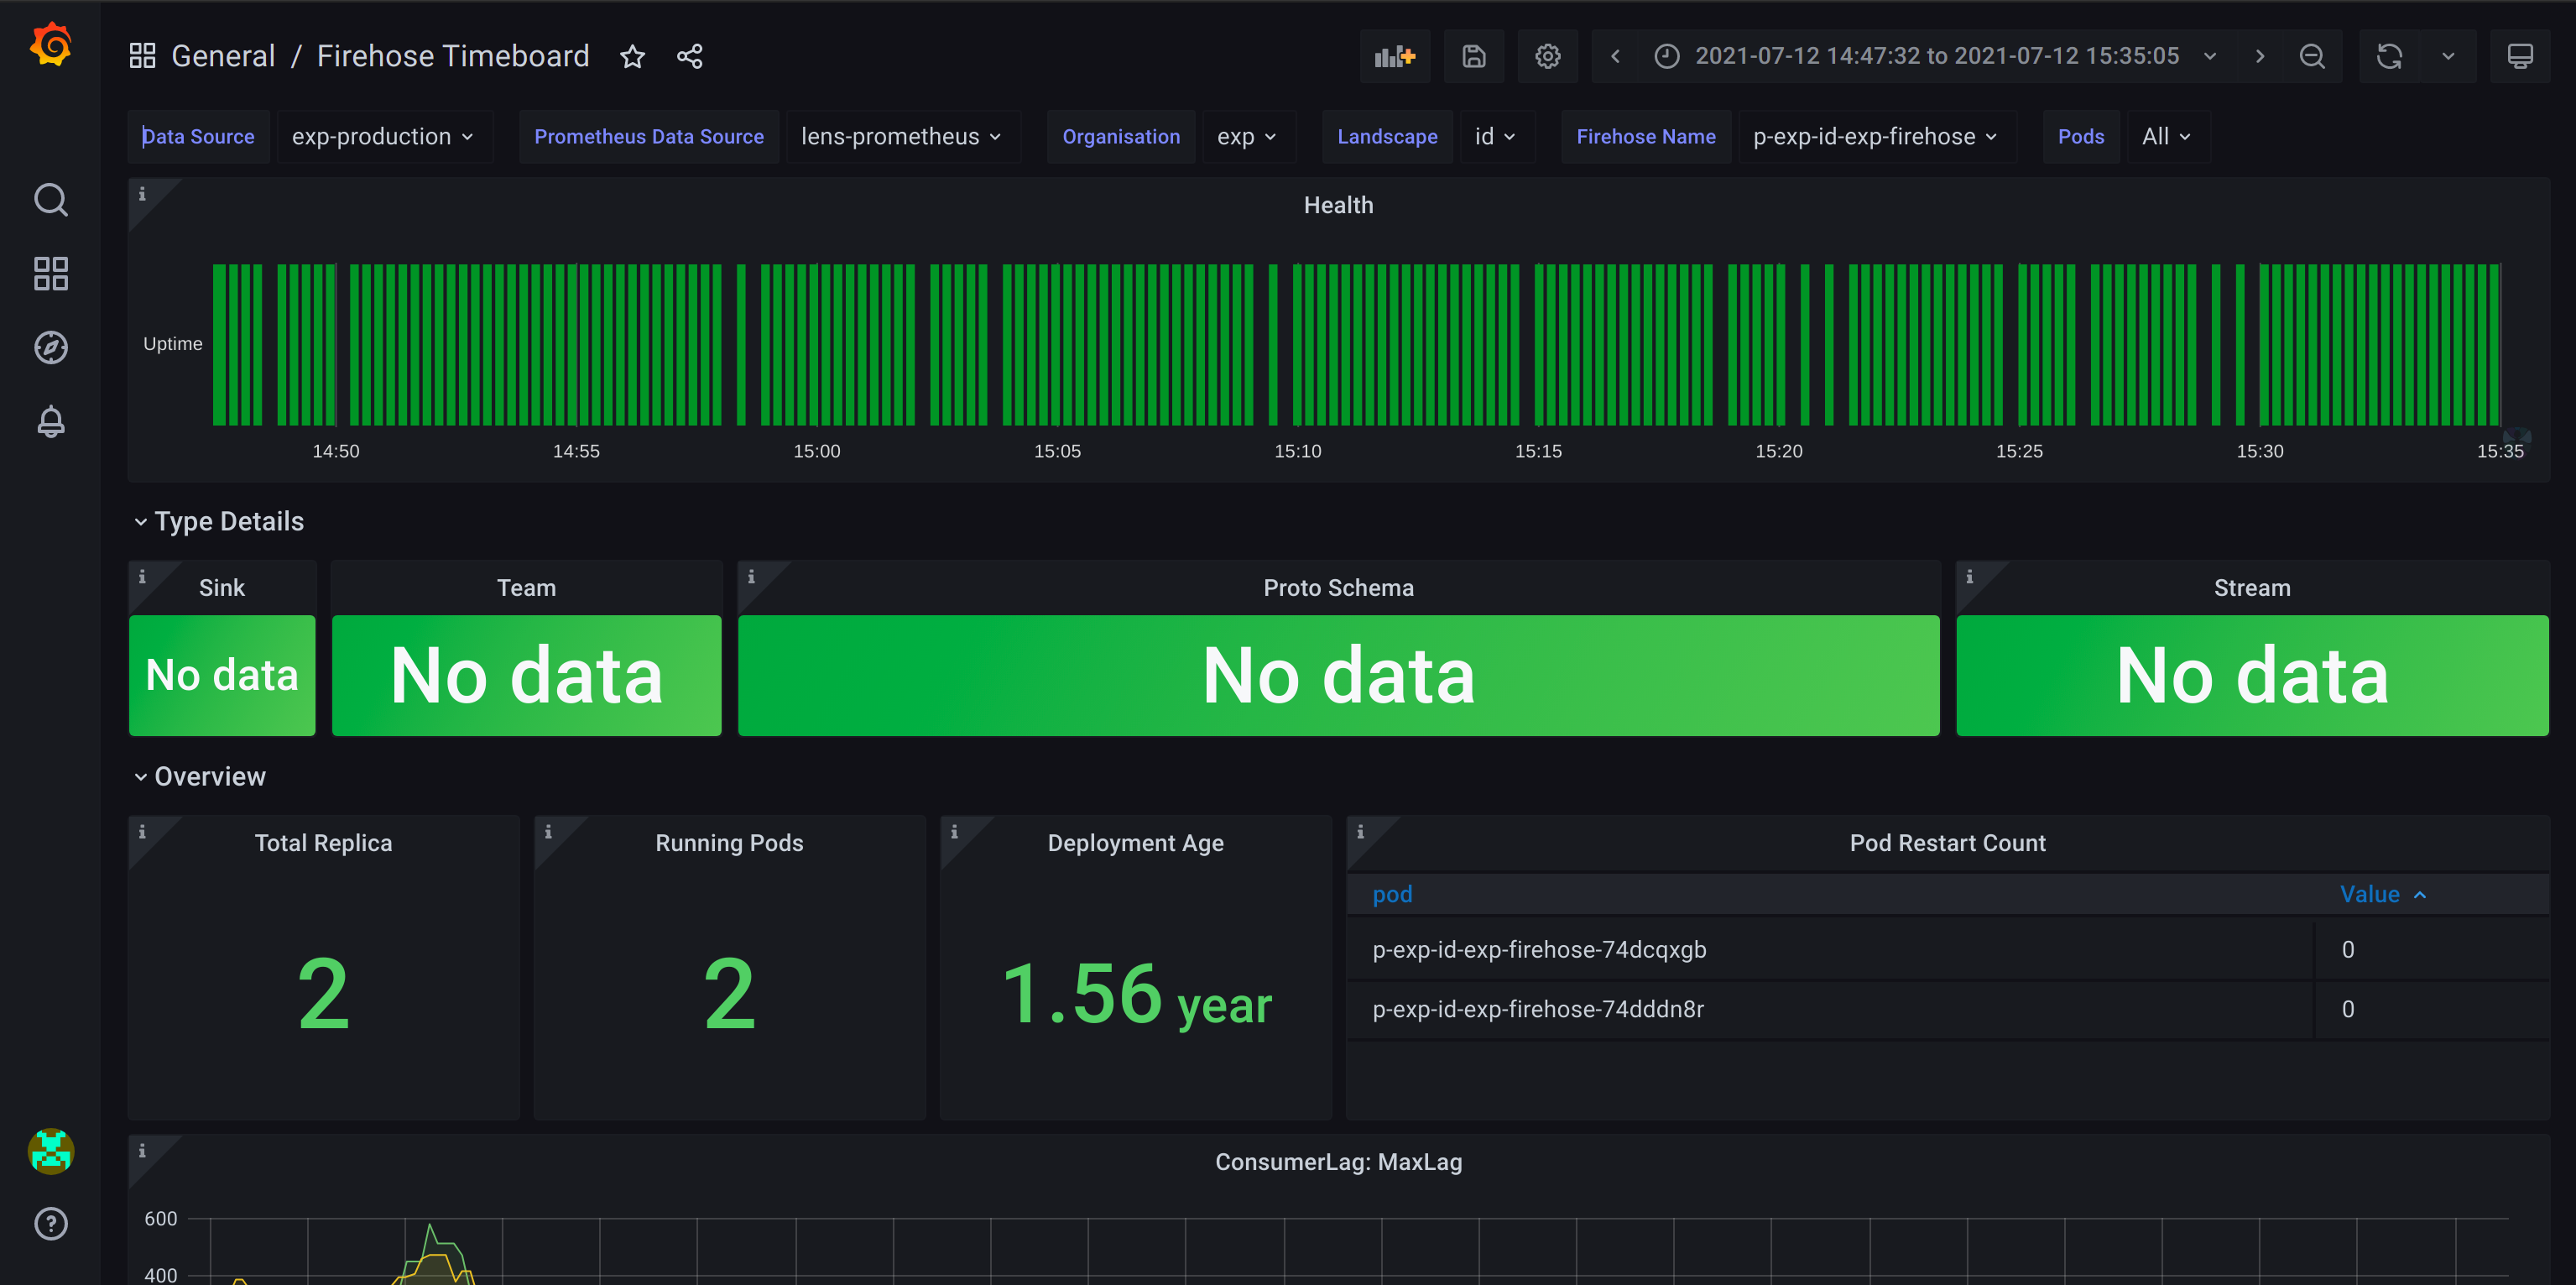
Load a Firehose dashboard by configuring the following parameters -
- Data Source - name of InfluxDB database for metrics
- Prometheus Data Source - Prometheus cluster name if any
- Organization - name of the InfluxDB organization
- Firehose Name - the Firehose Kafka Consumer Group ID
- Pod - specify a particular Kubernetes pod ID or select All to track all pods.
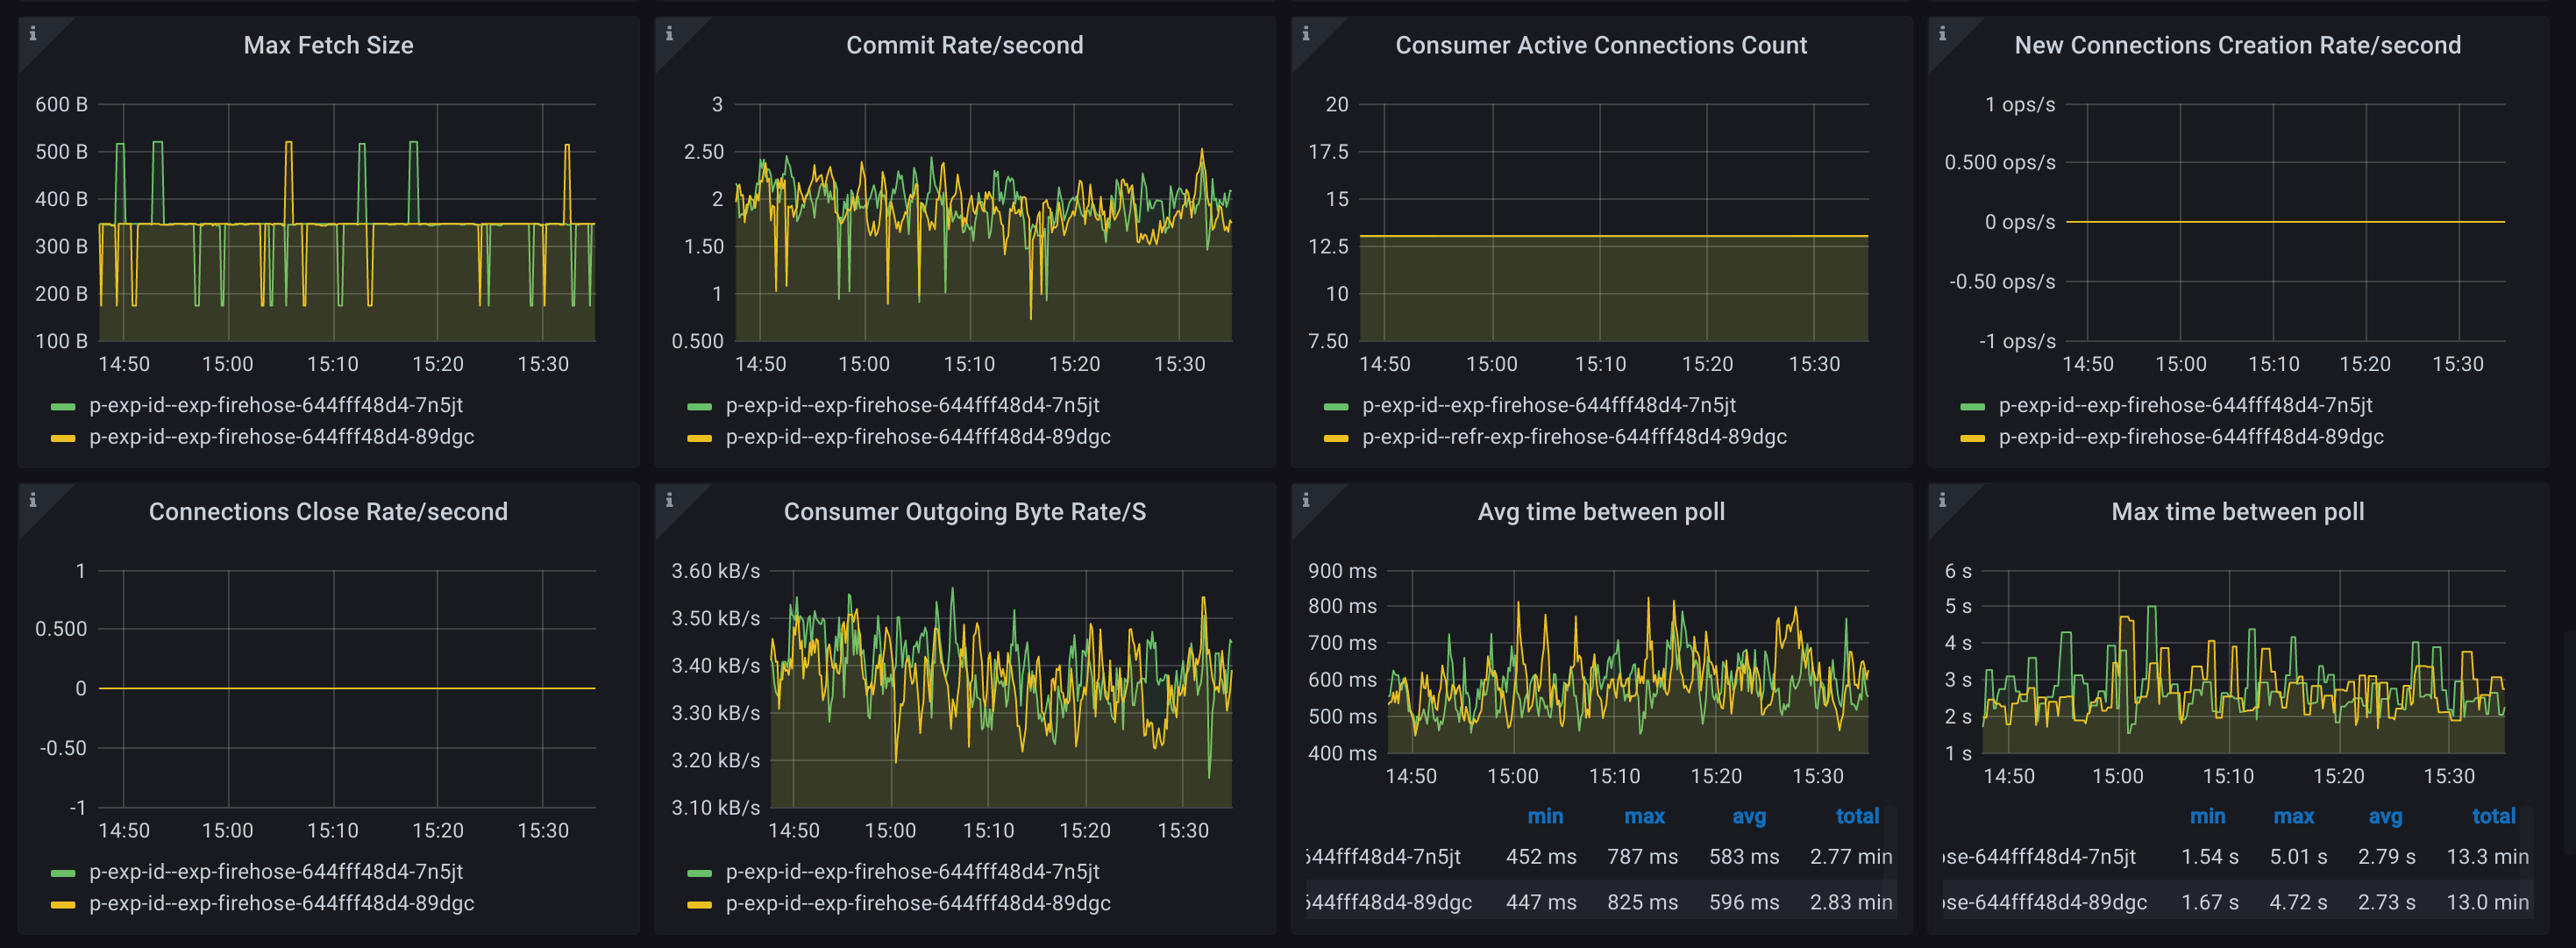
Features of Grafana dashboard
- metrics of every pod at any point of time can be obtained by hovering over that time coordinate.
- each pod has its own color code to distinguish it from other pods, in the visualization graph.
- minimum, maximum, and average values of the metrics are displayed for every pod.
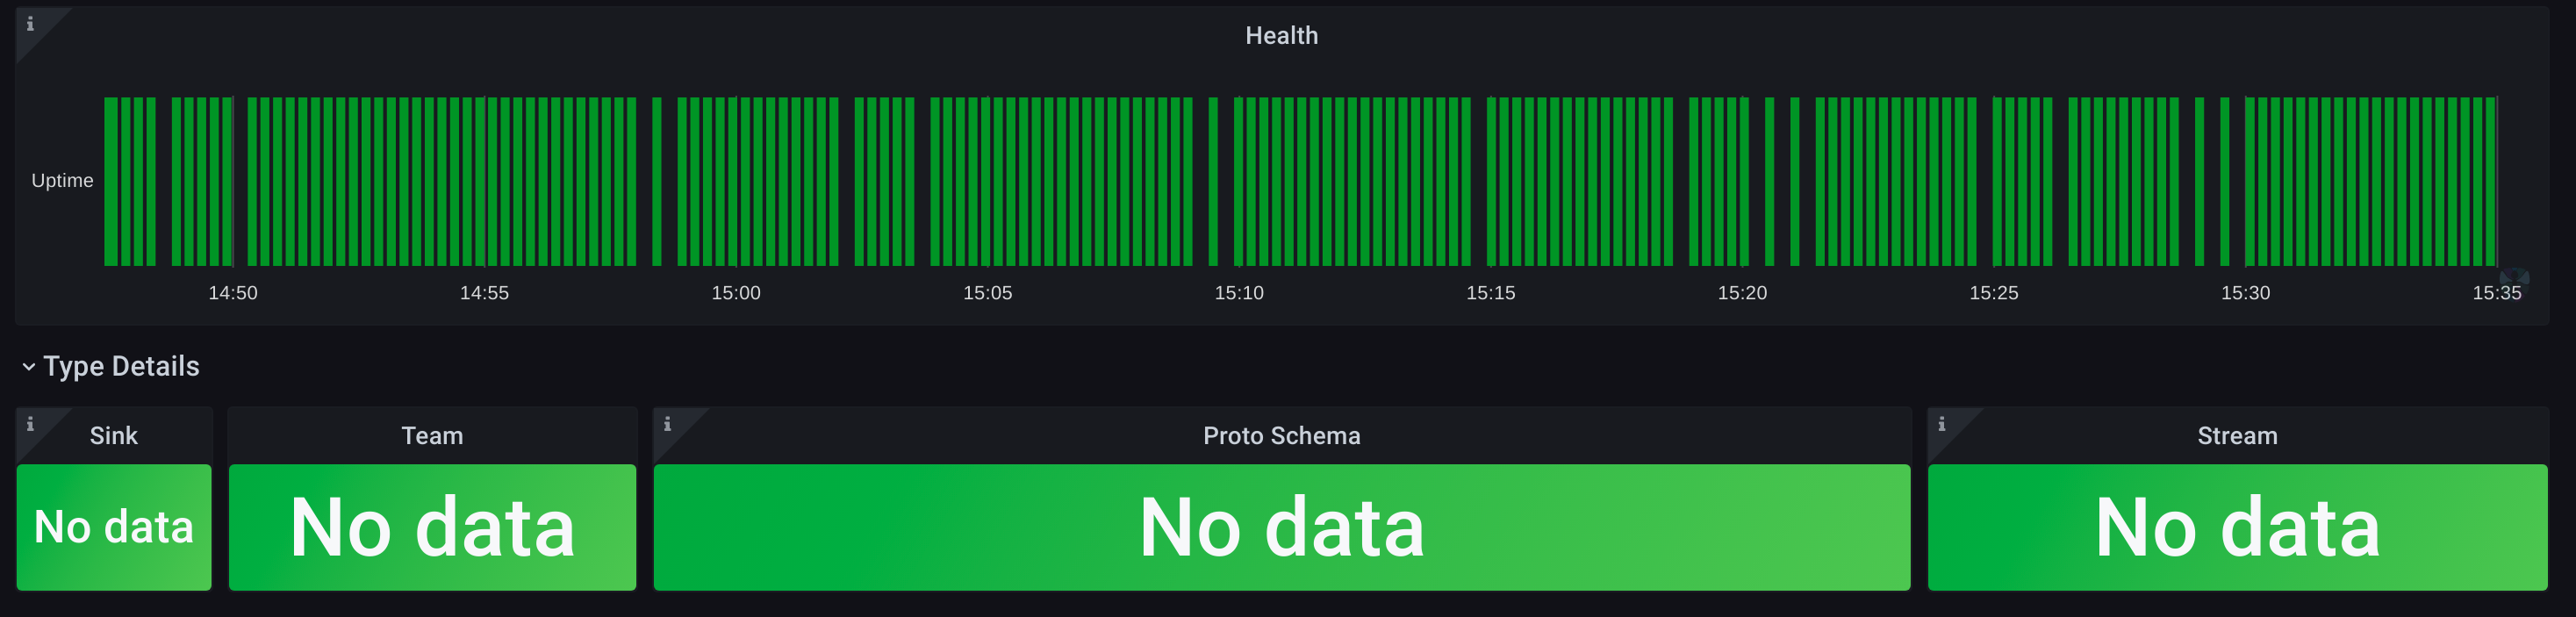
Dashboard Sections
Type Details
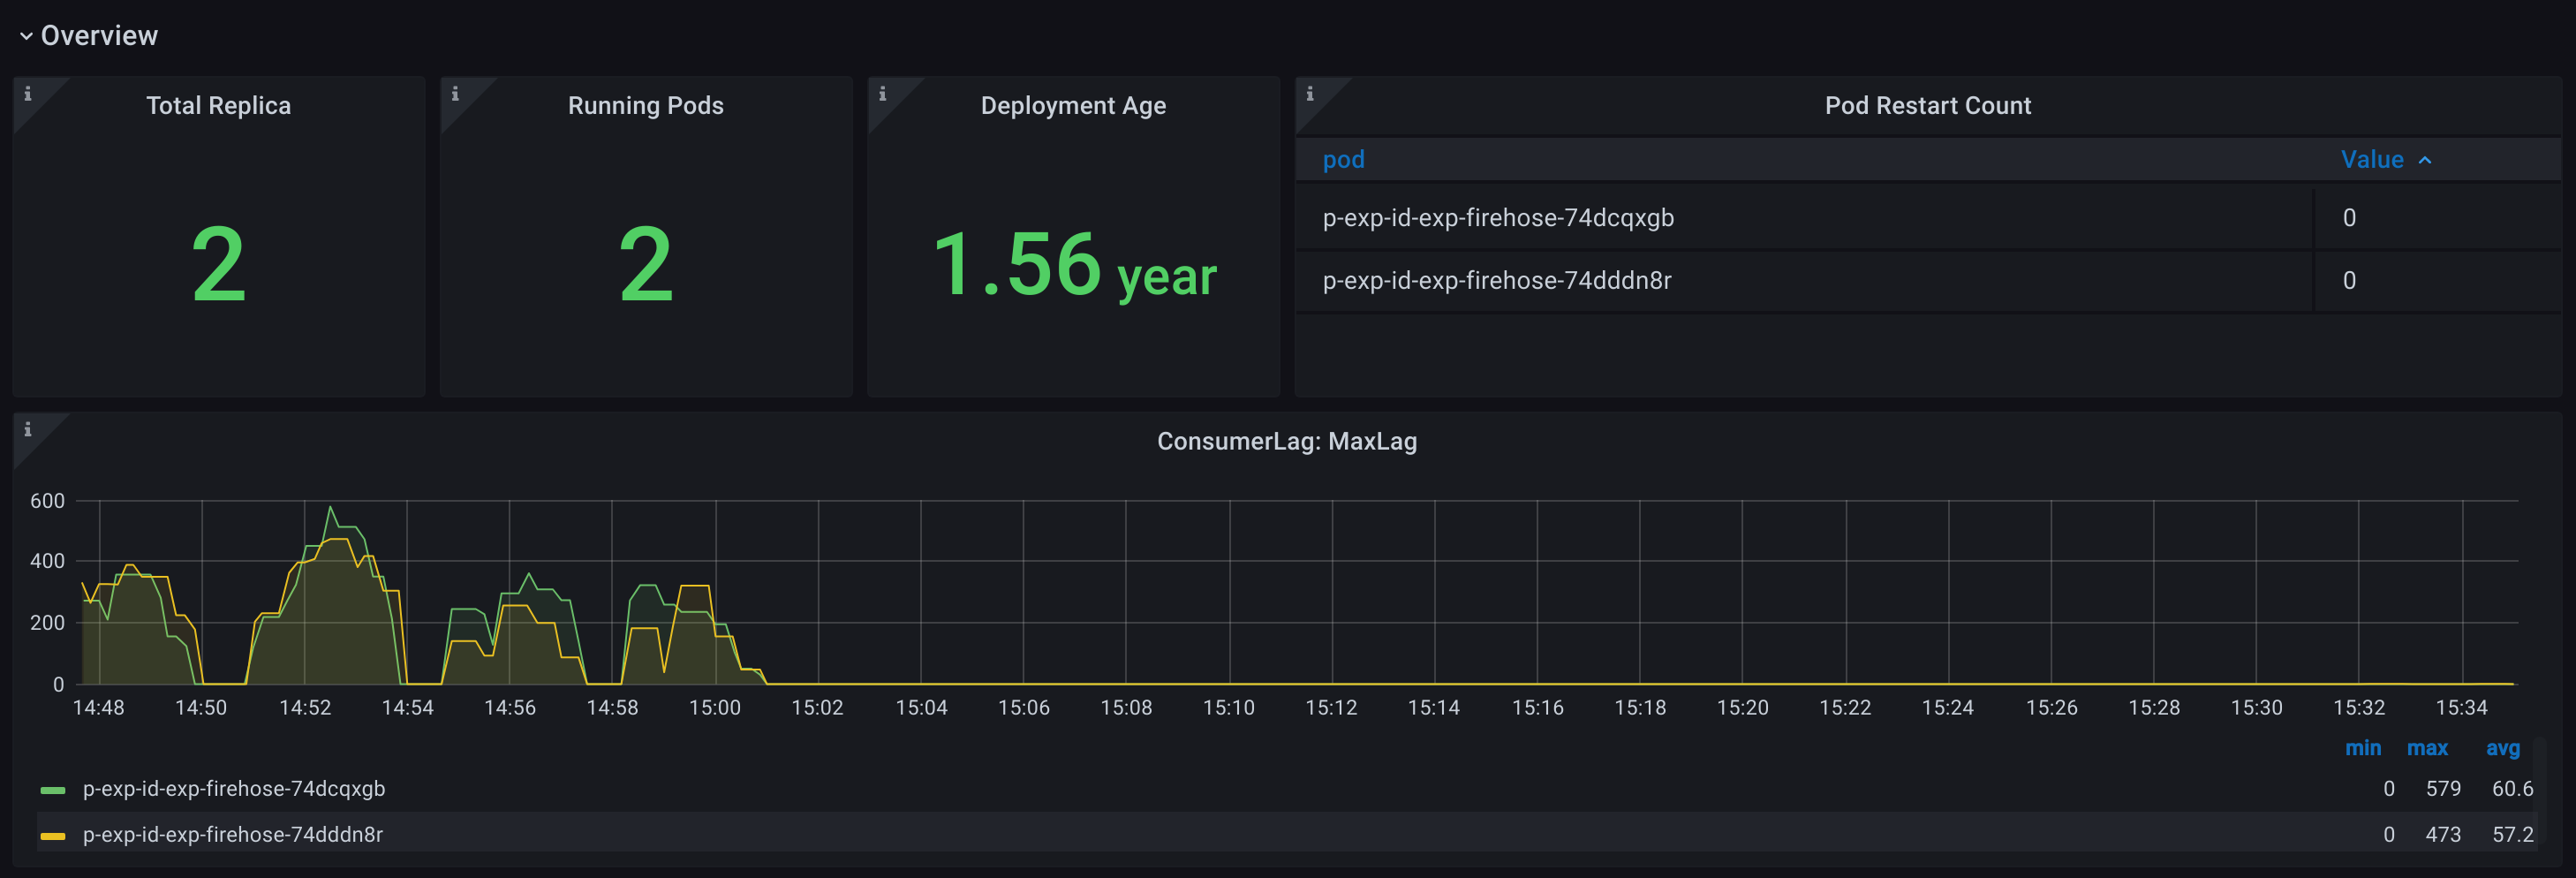
Overview
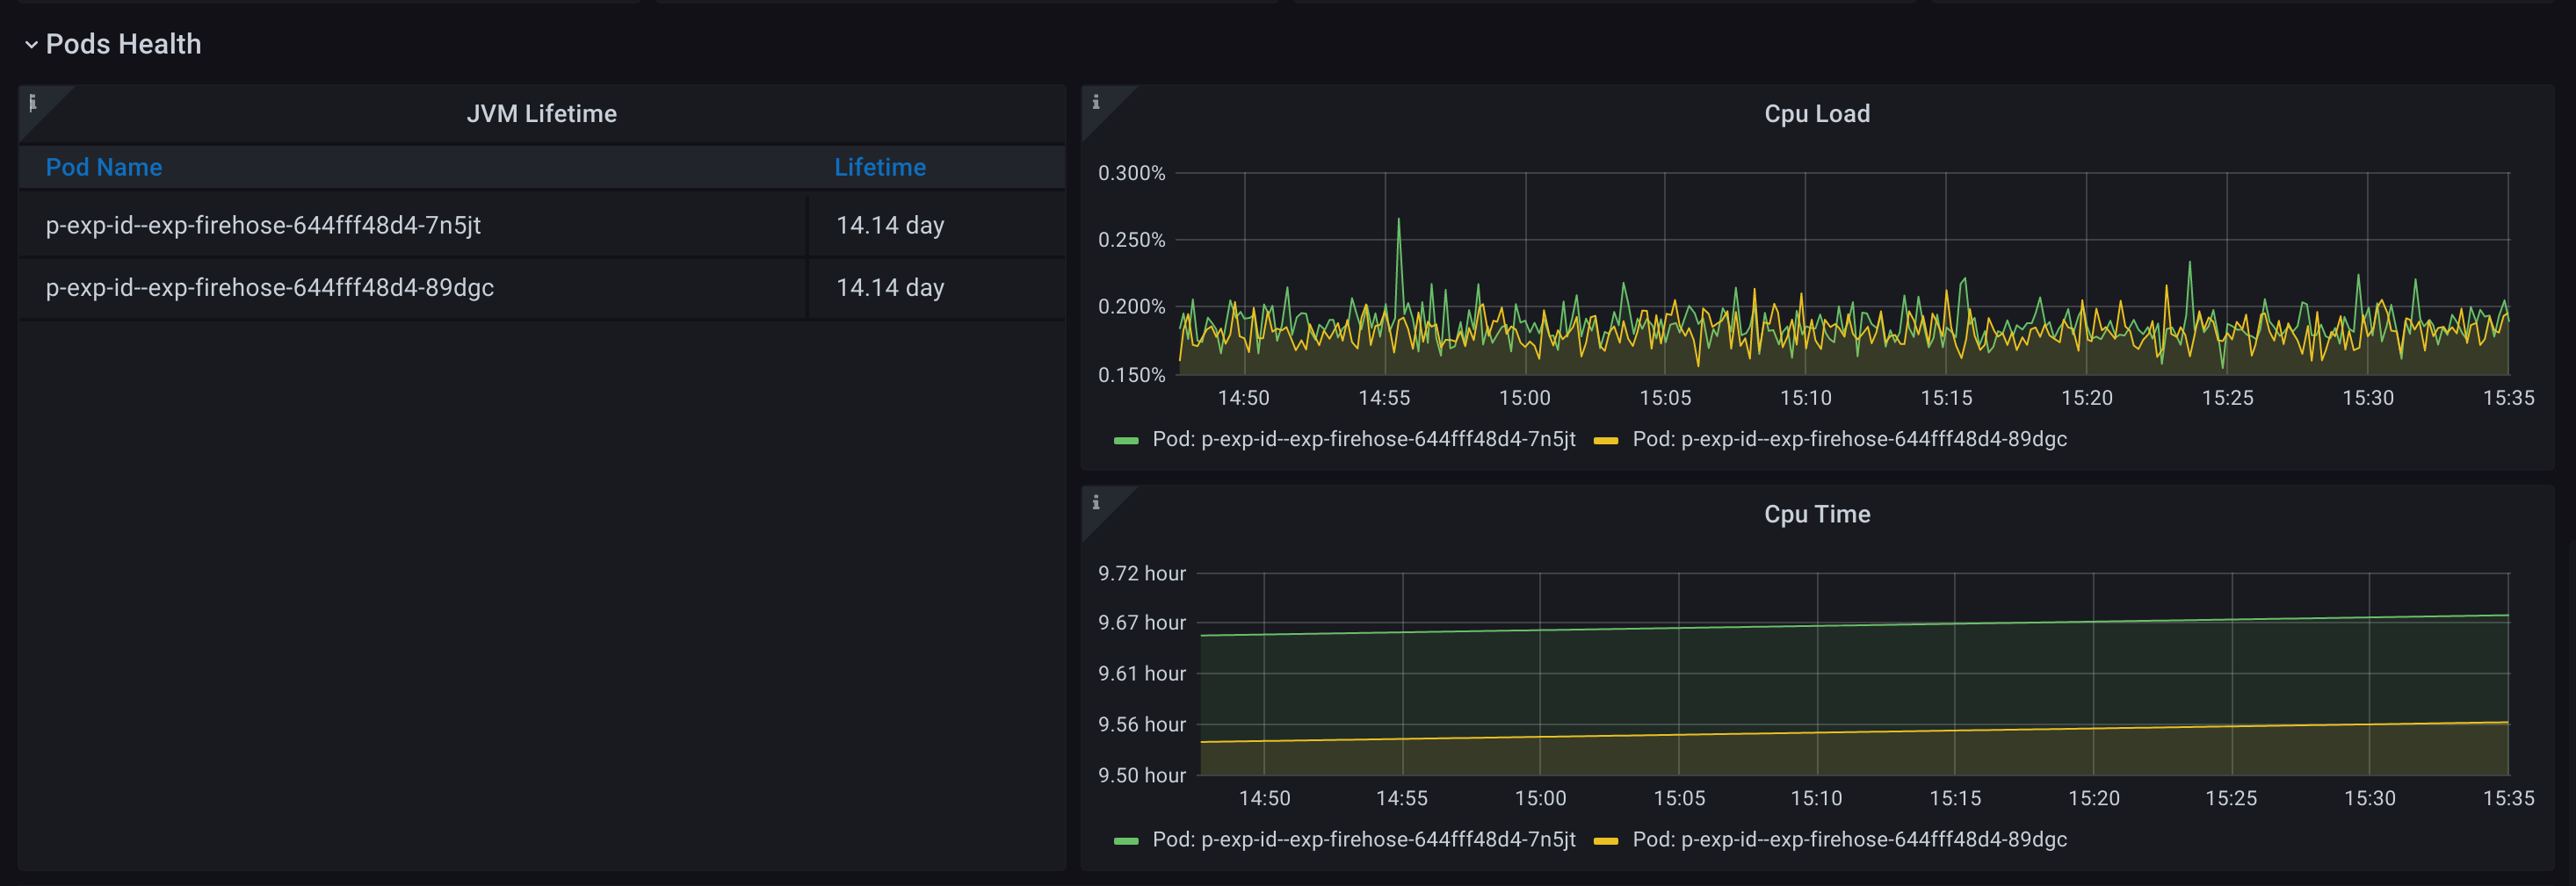
Pods Health
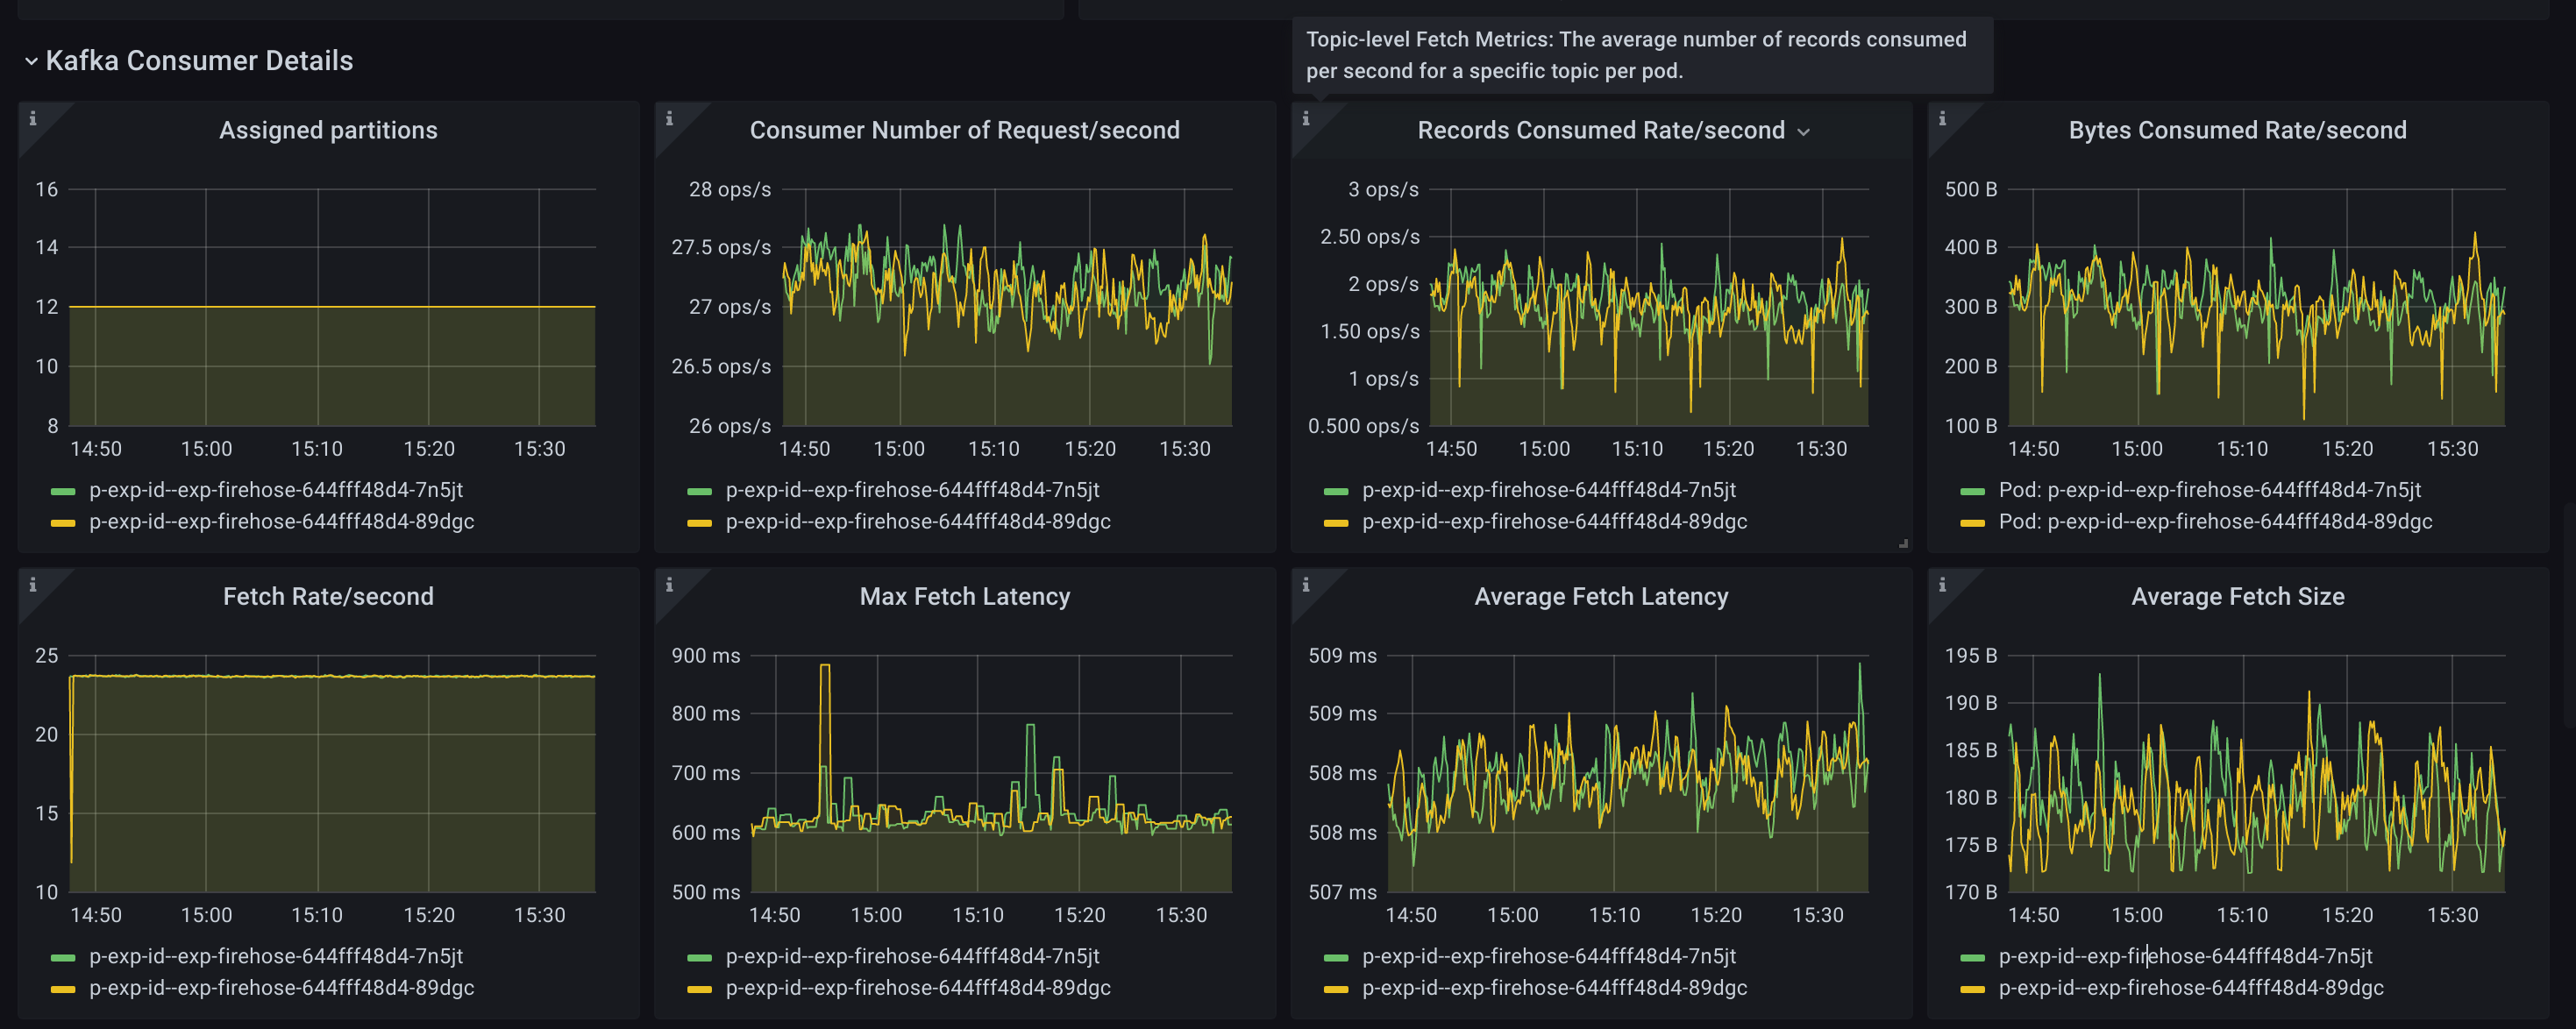
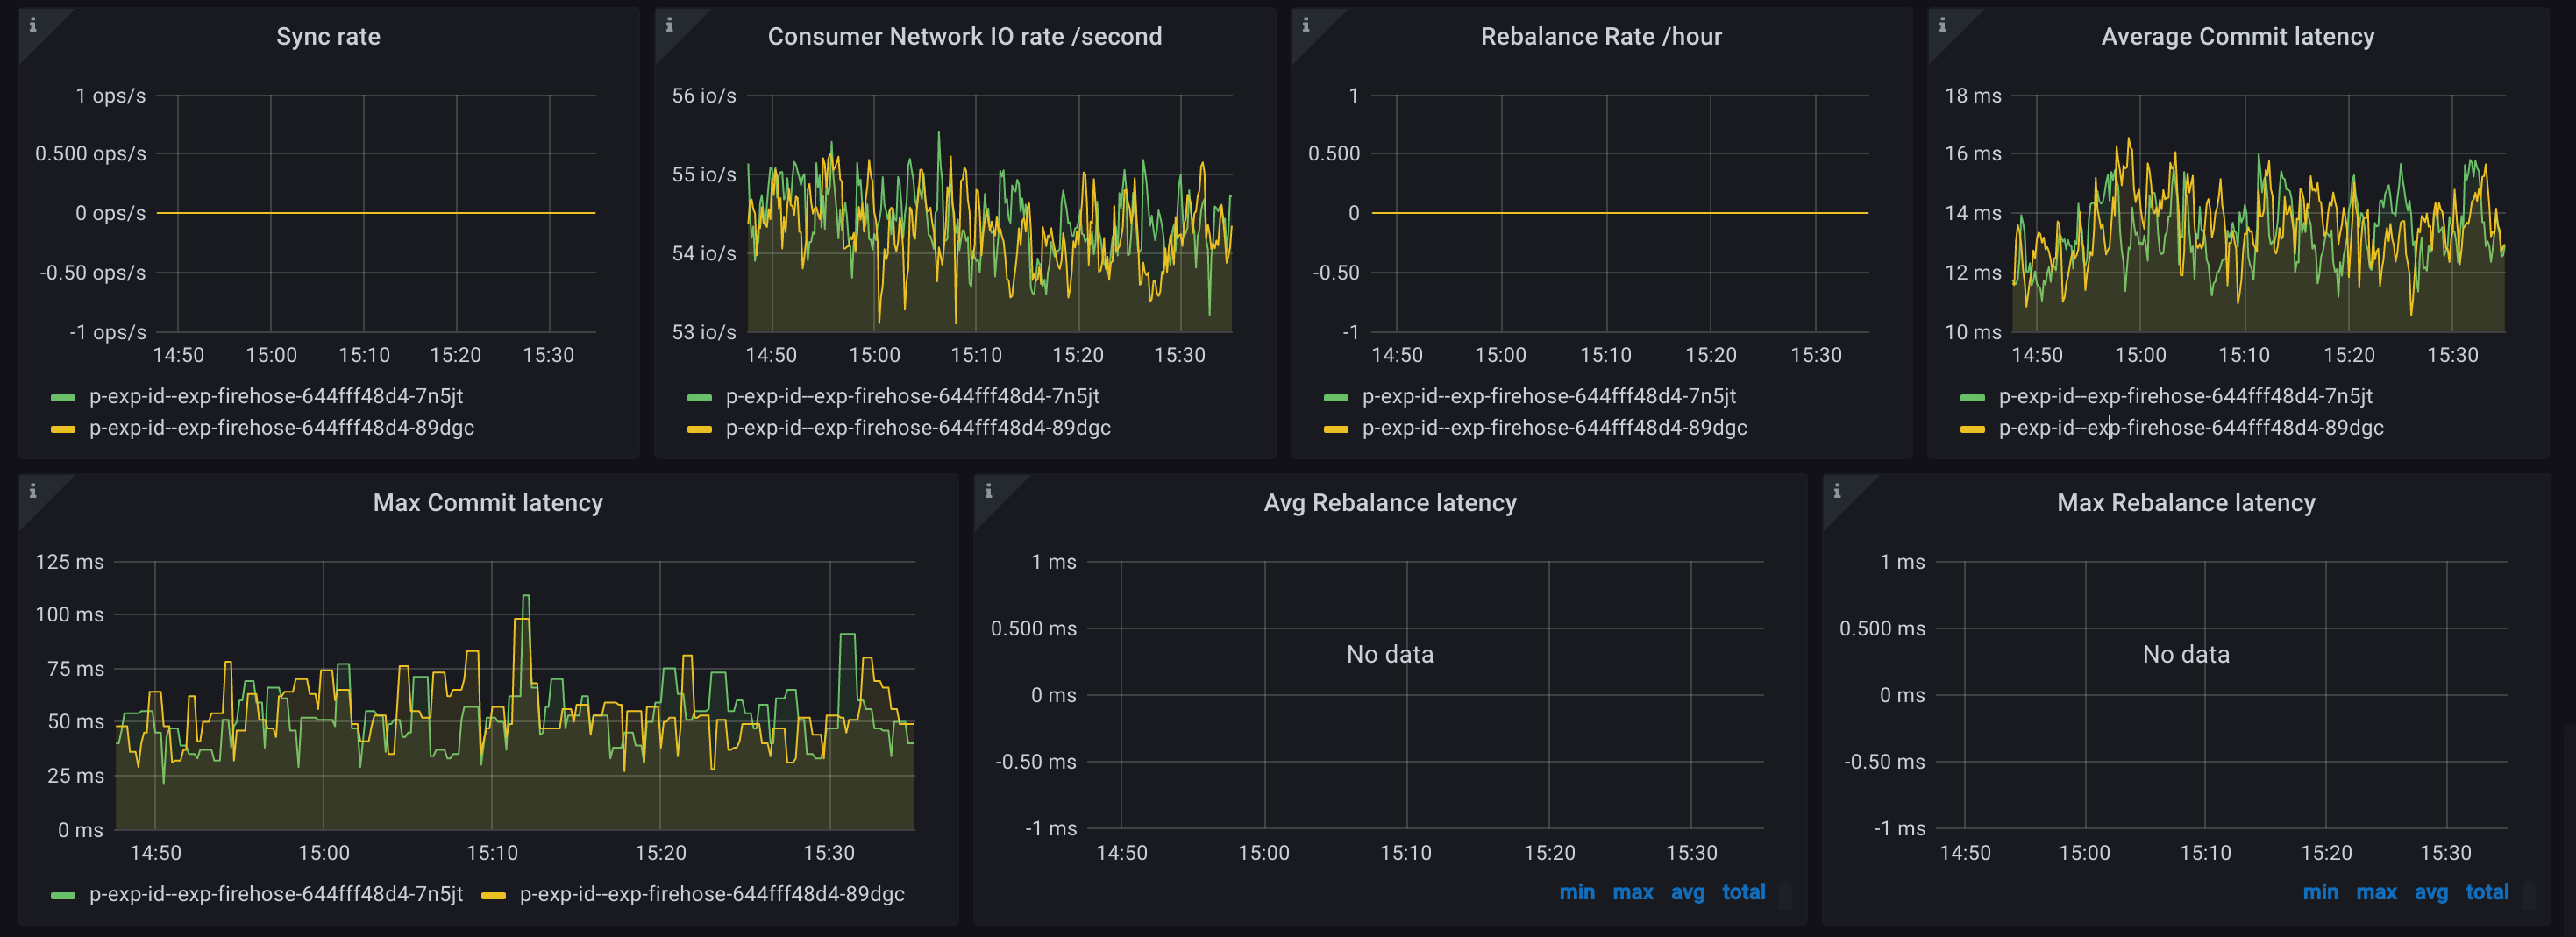
Kafka Consumer Details
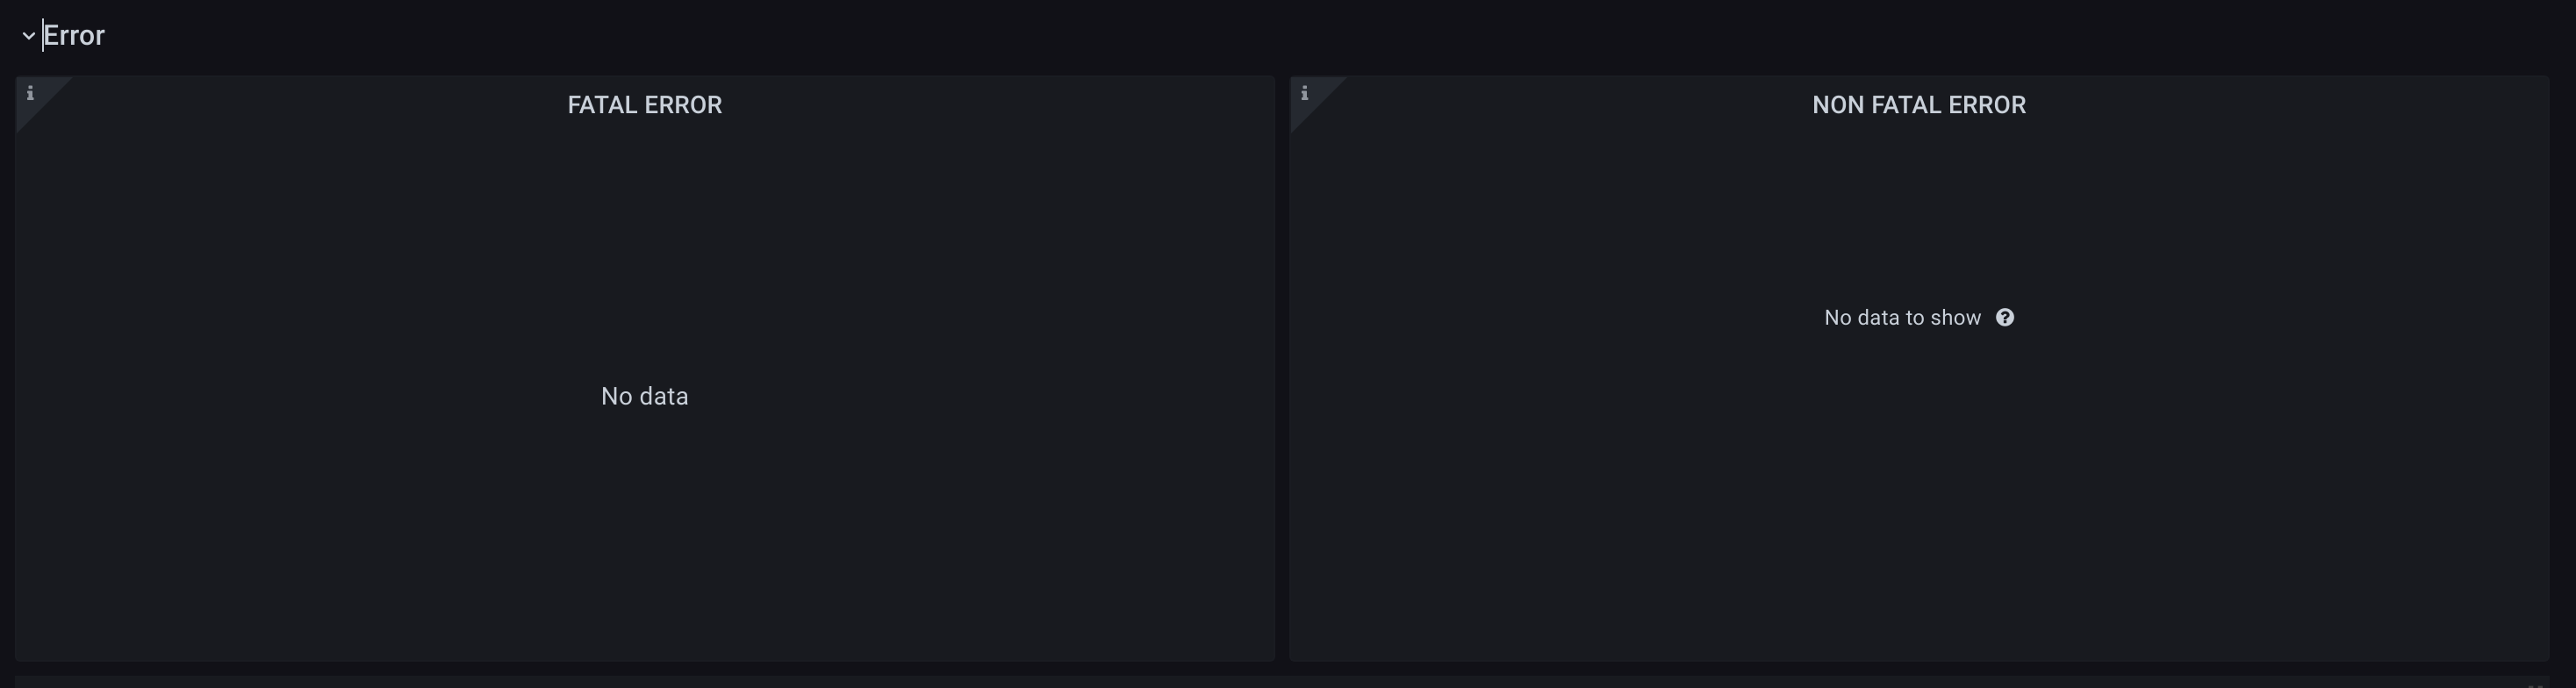
Error
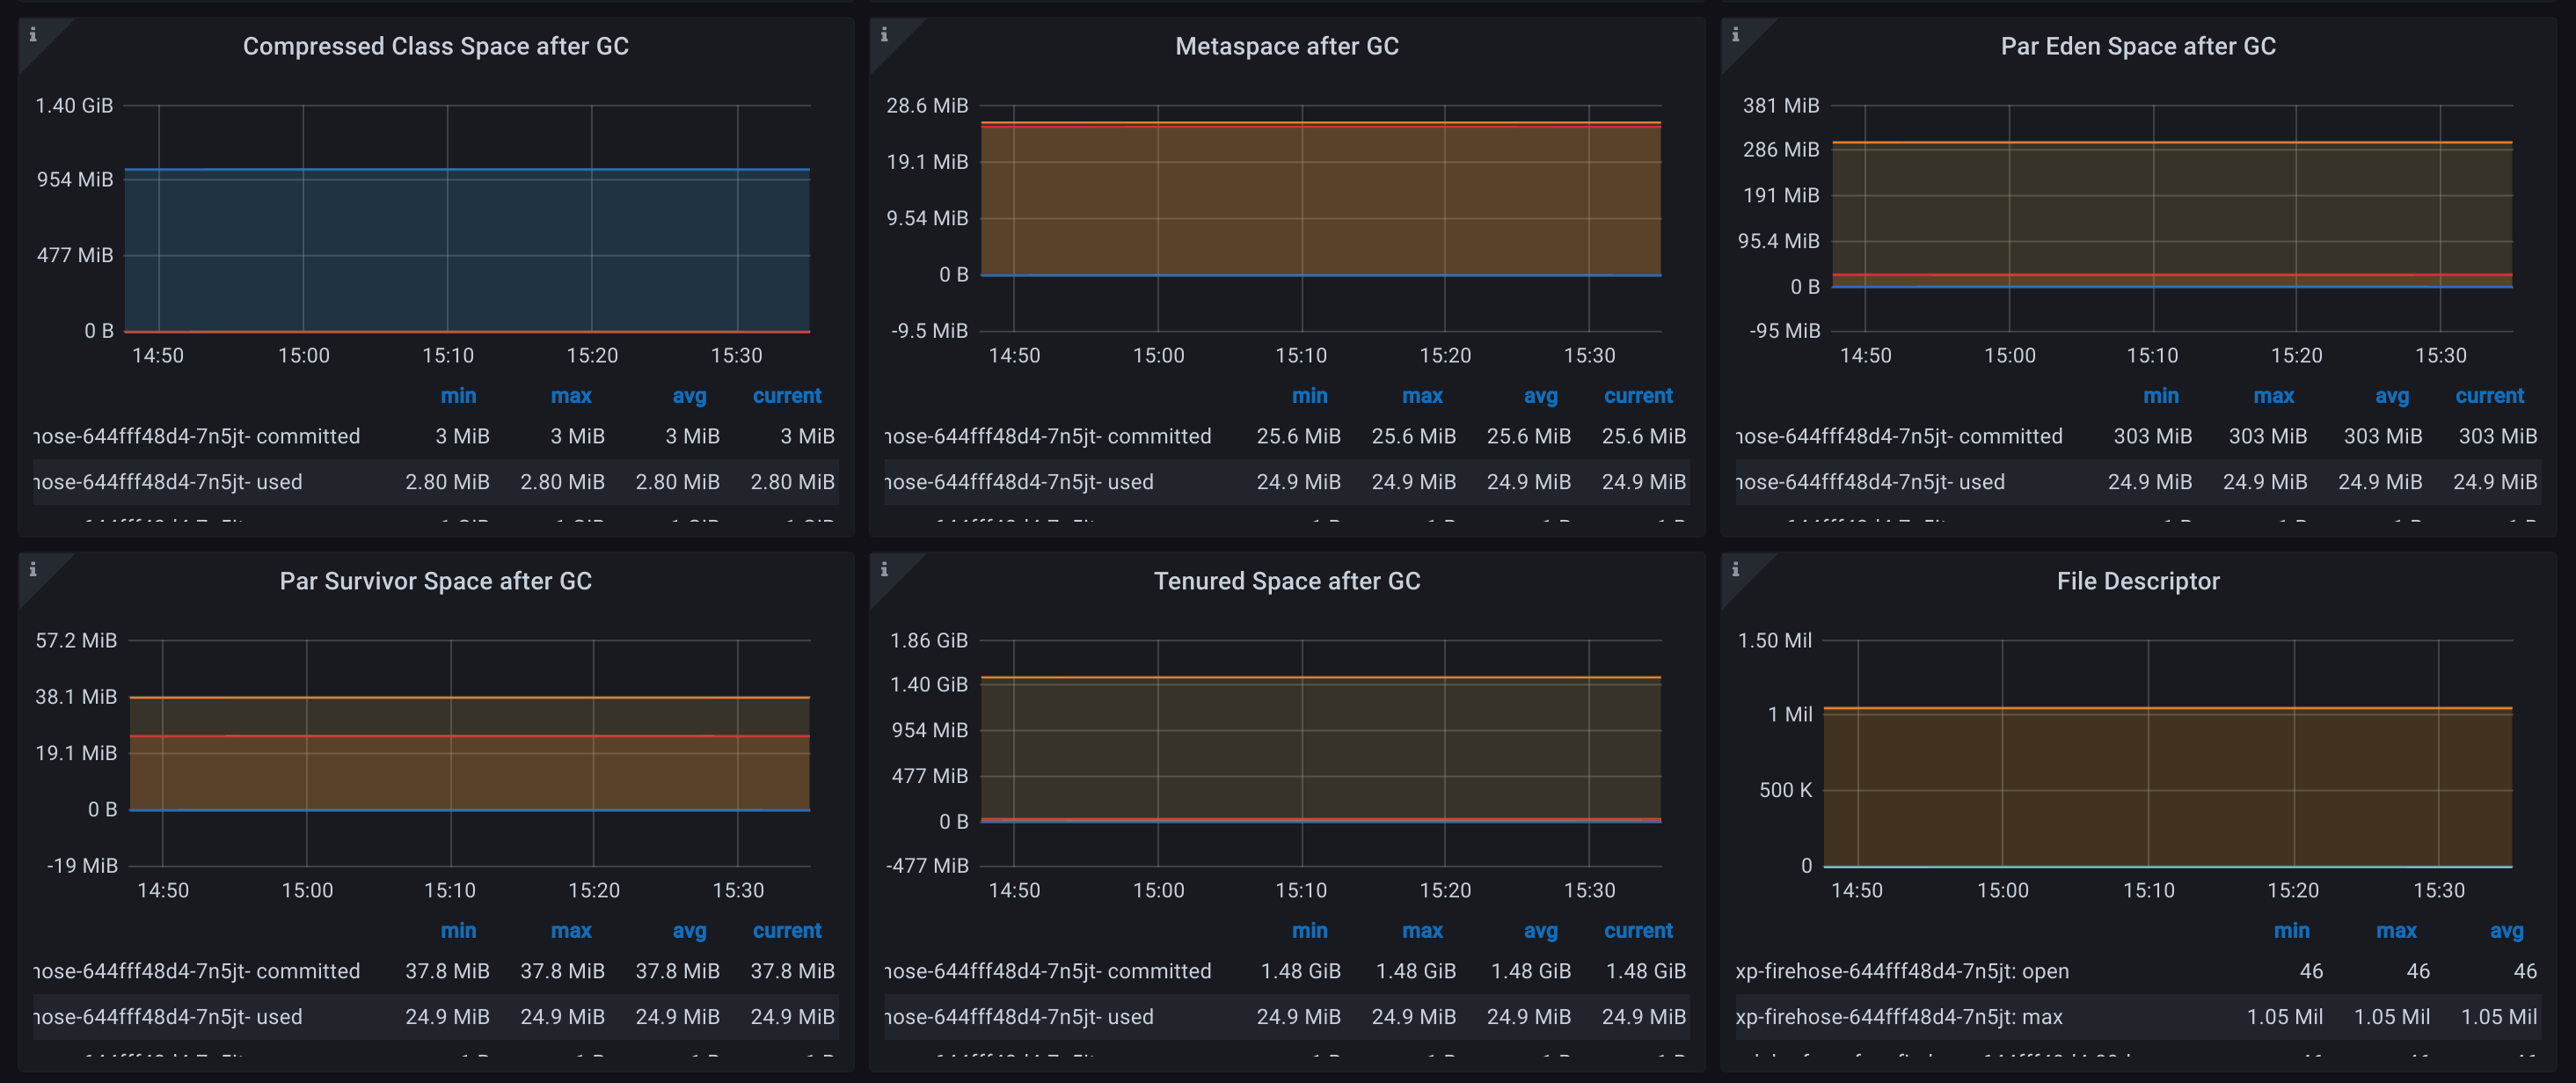
Memory
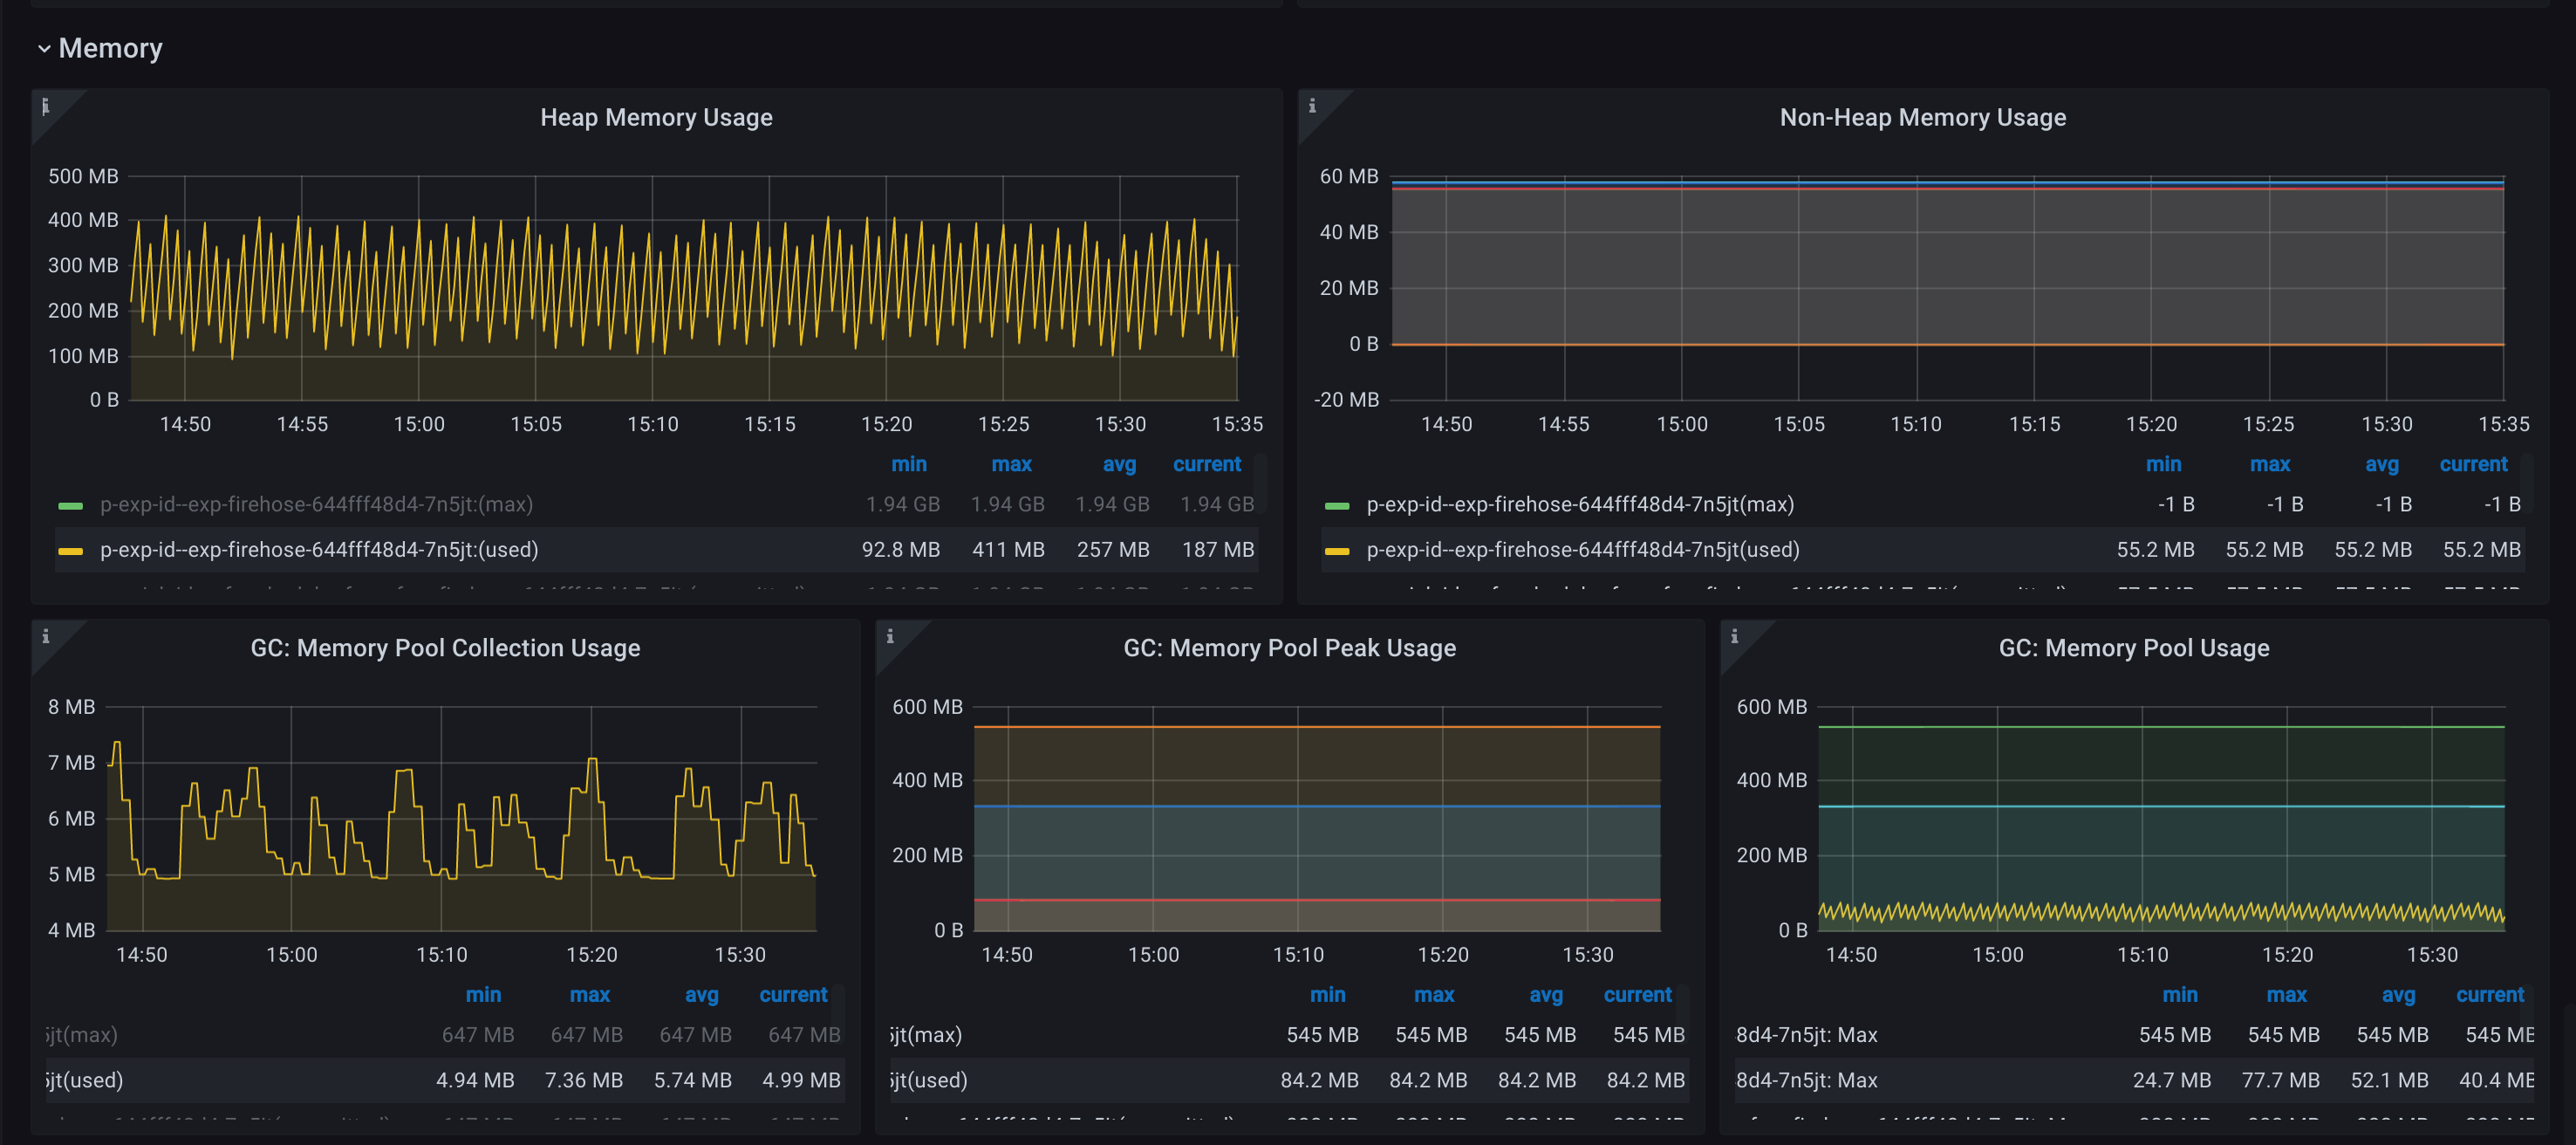
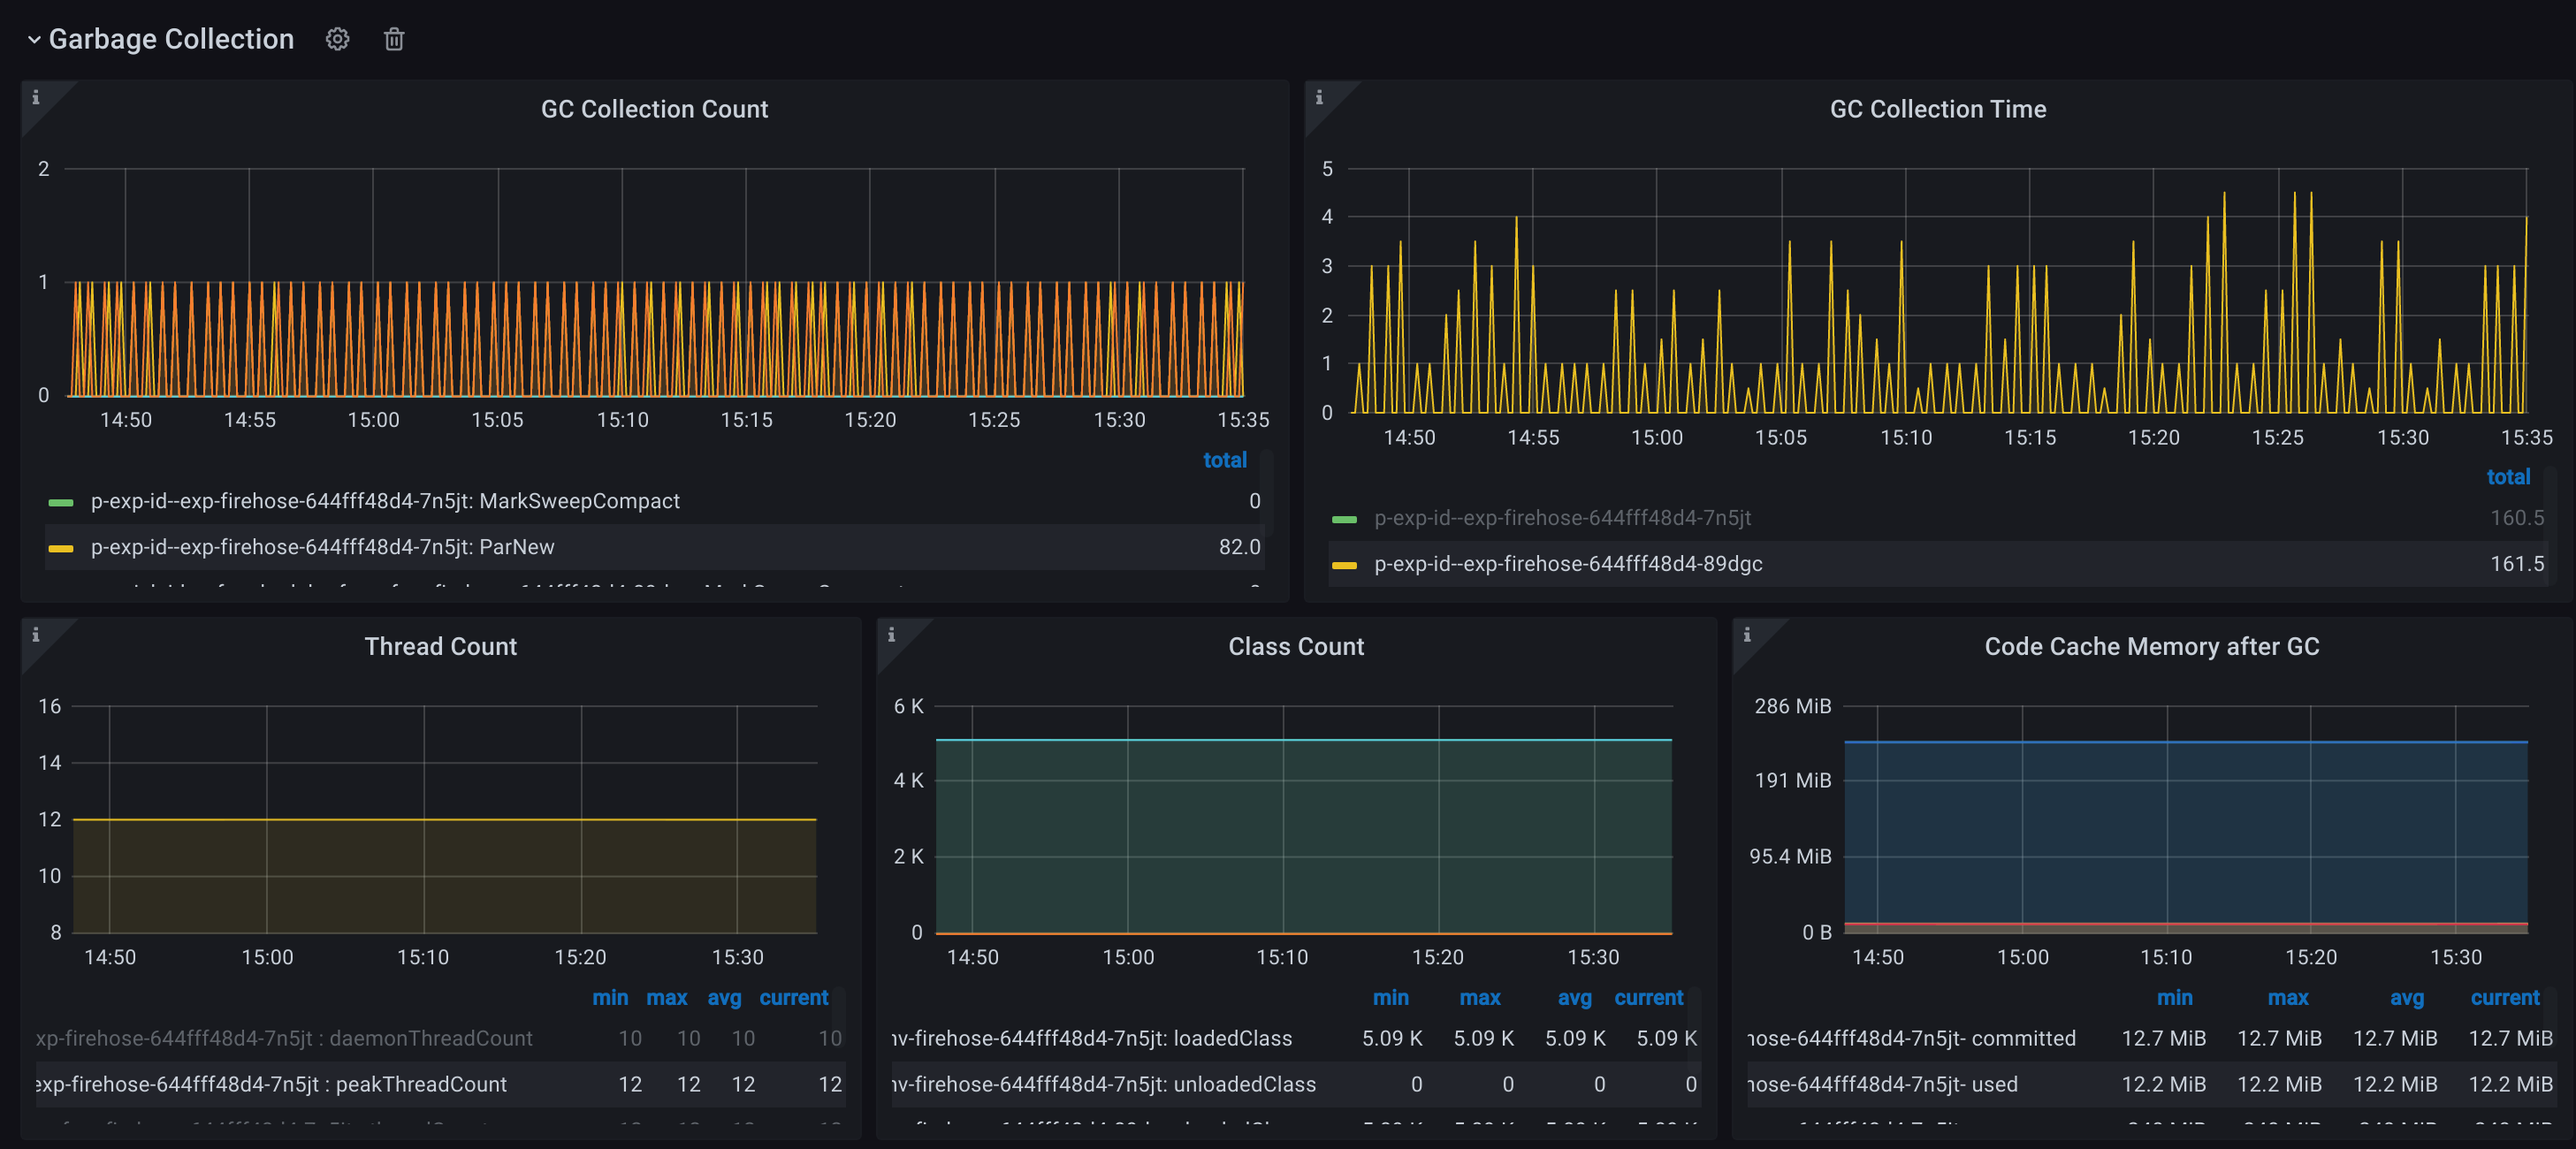
Garbage Collection
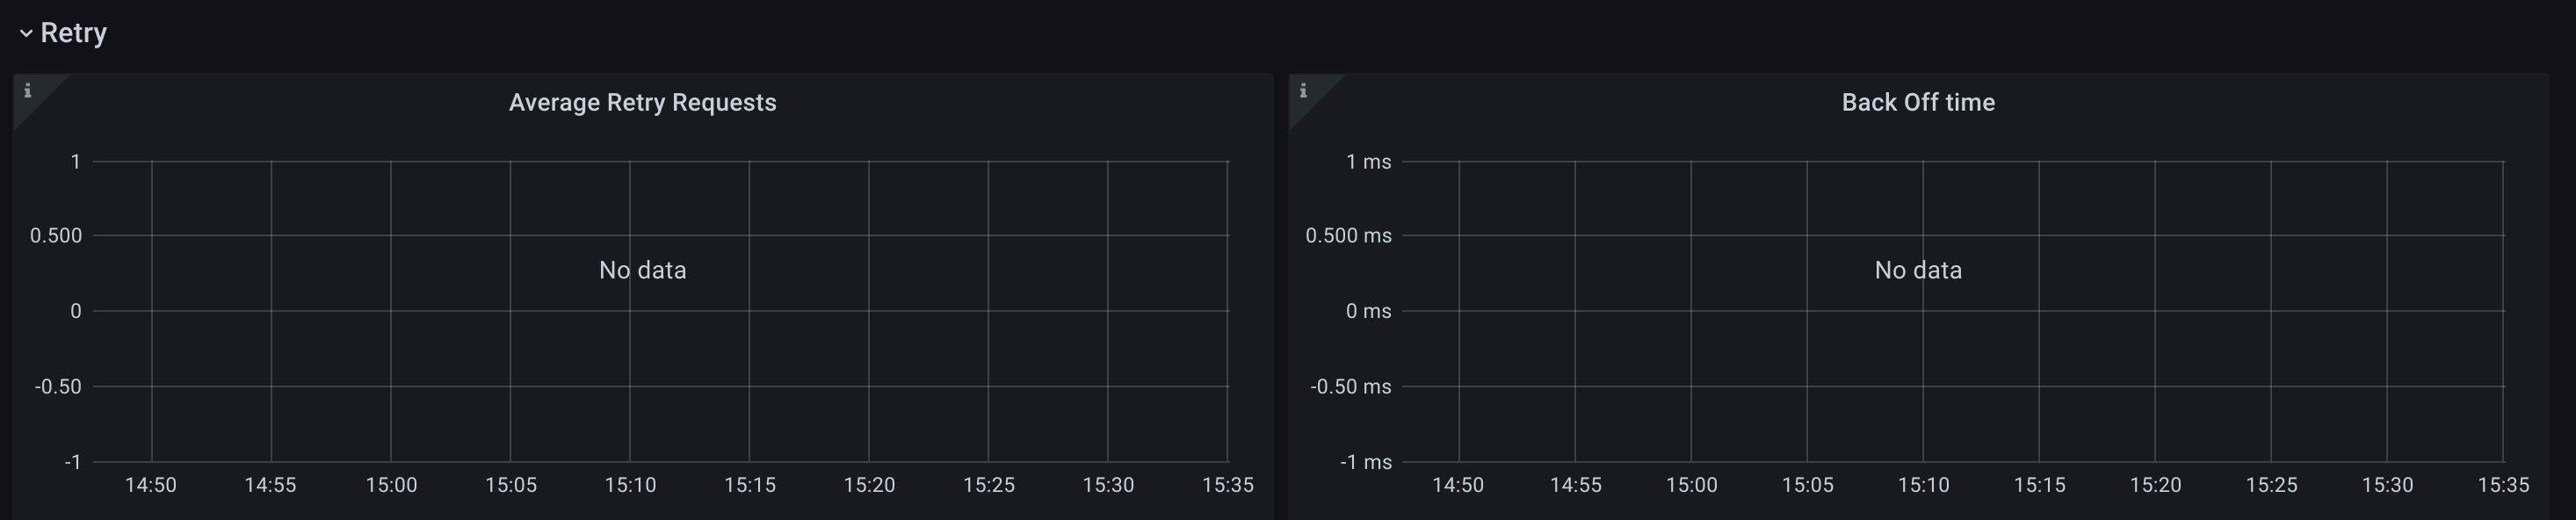
Retry
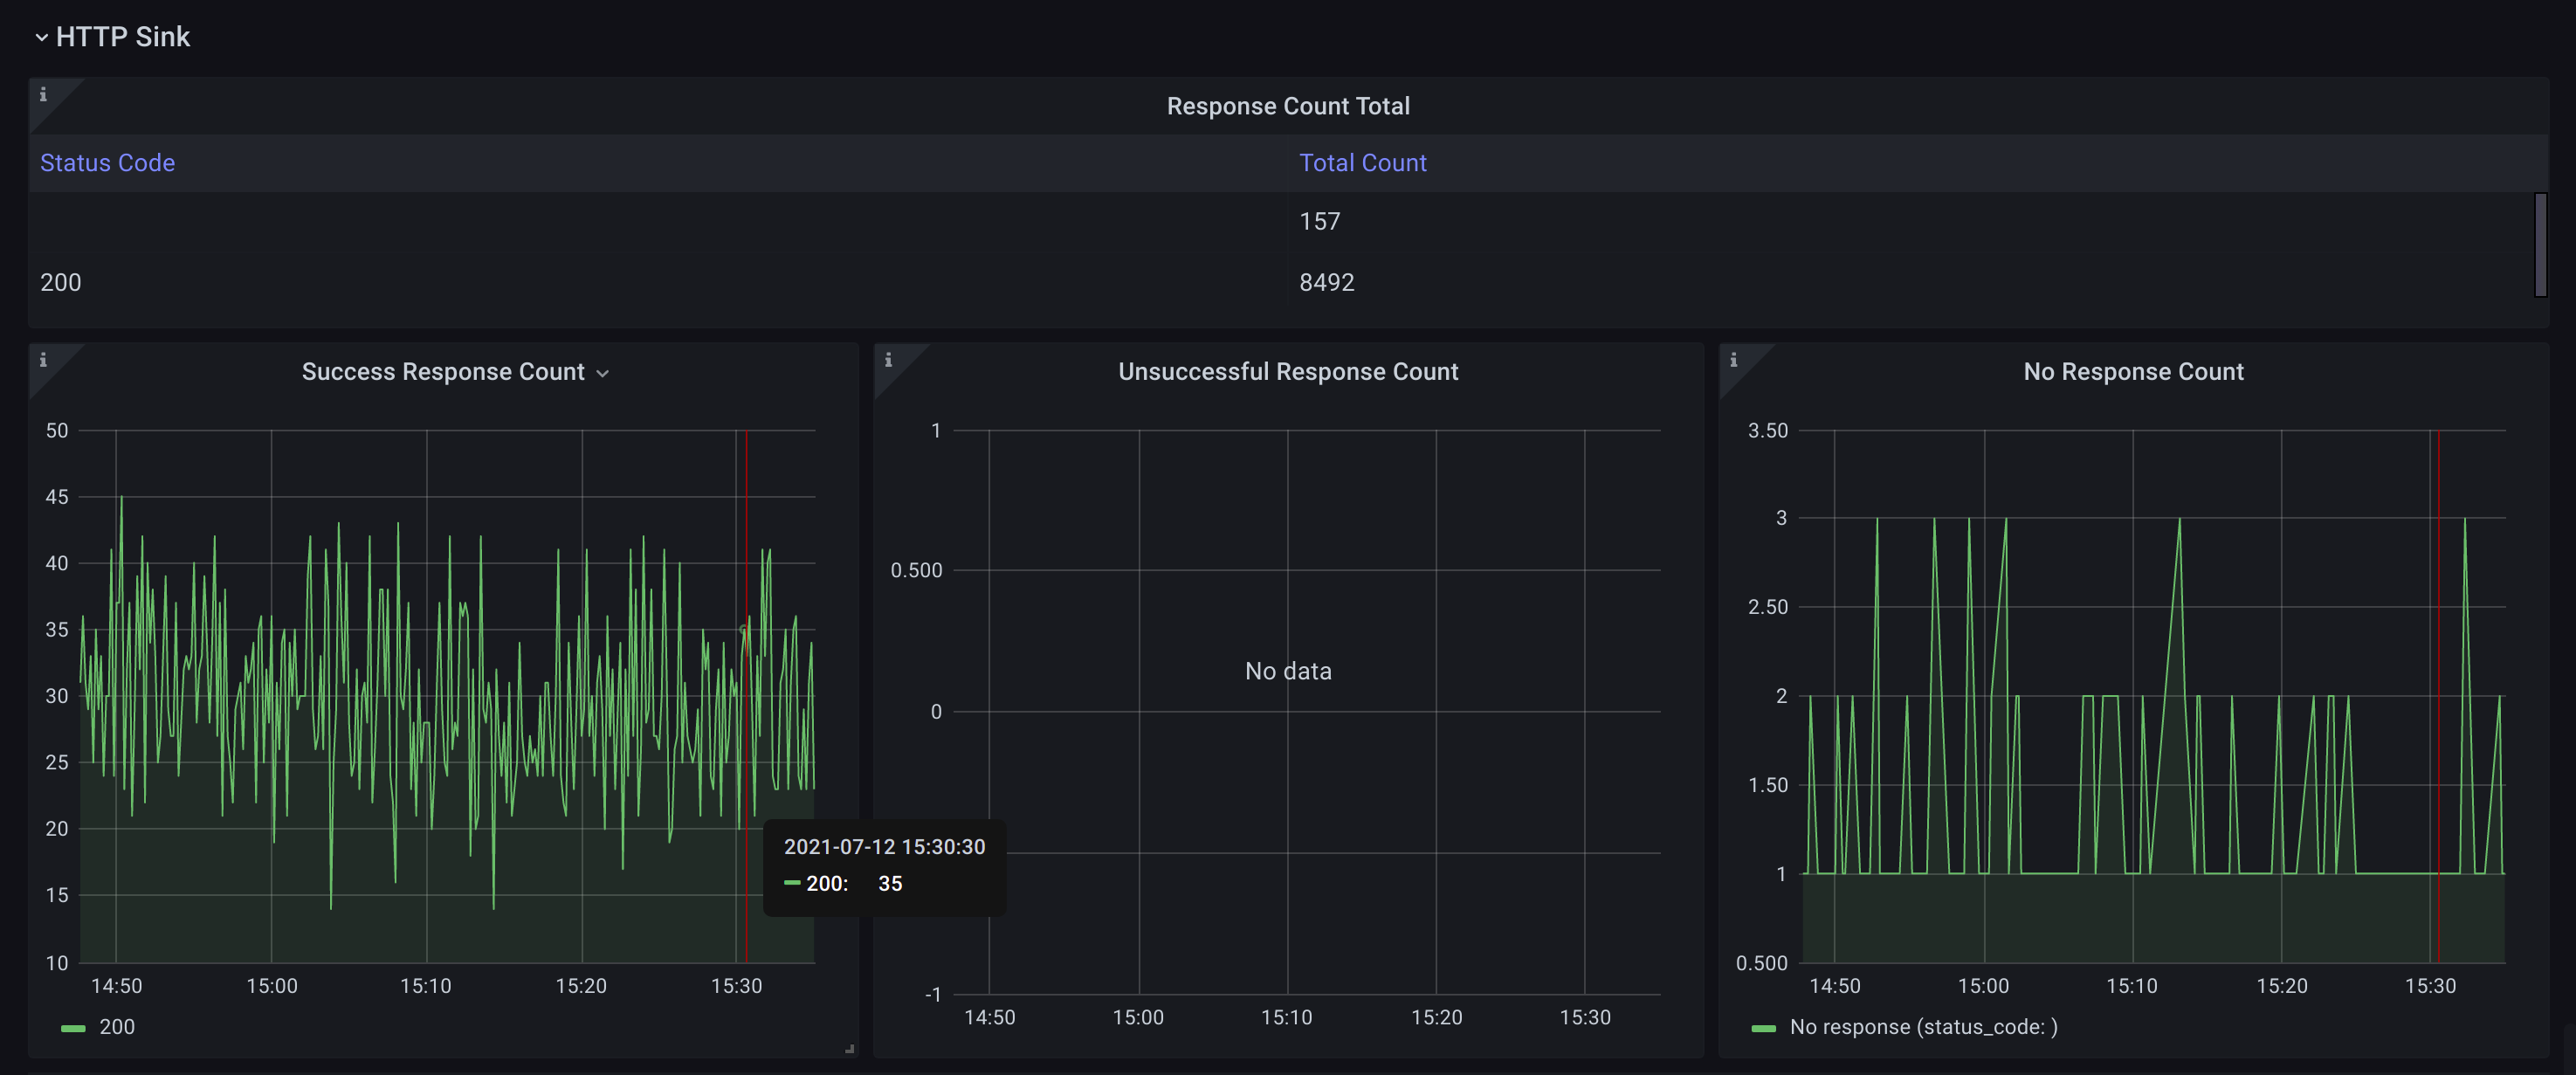
HTTP Sink
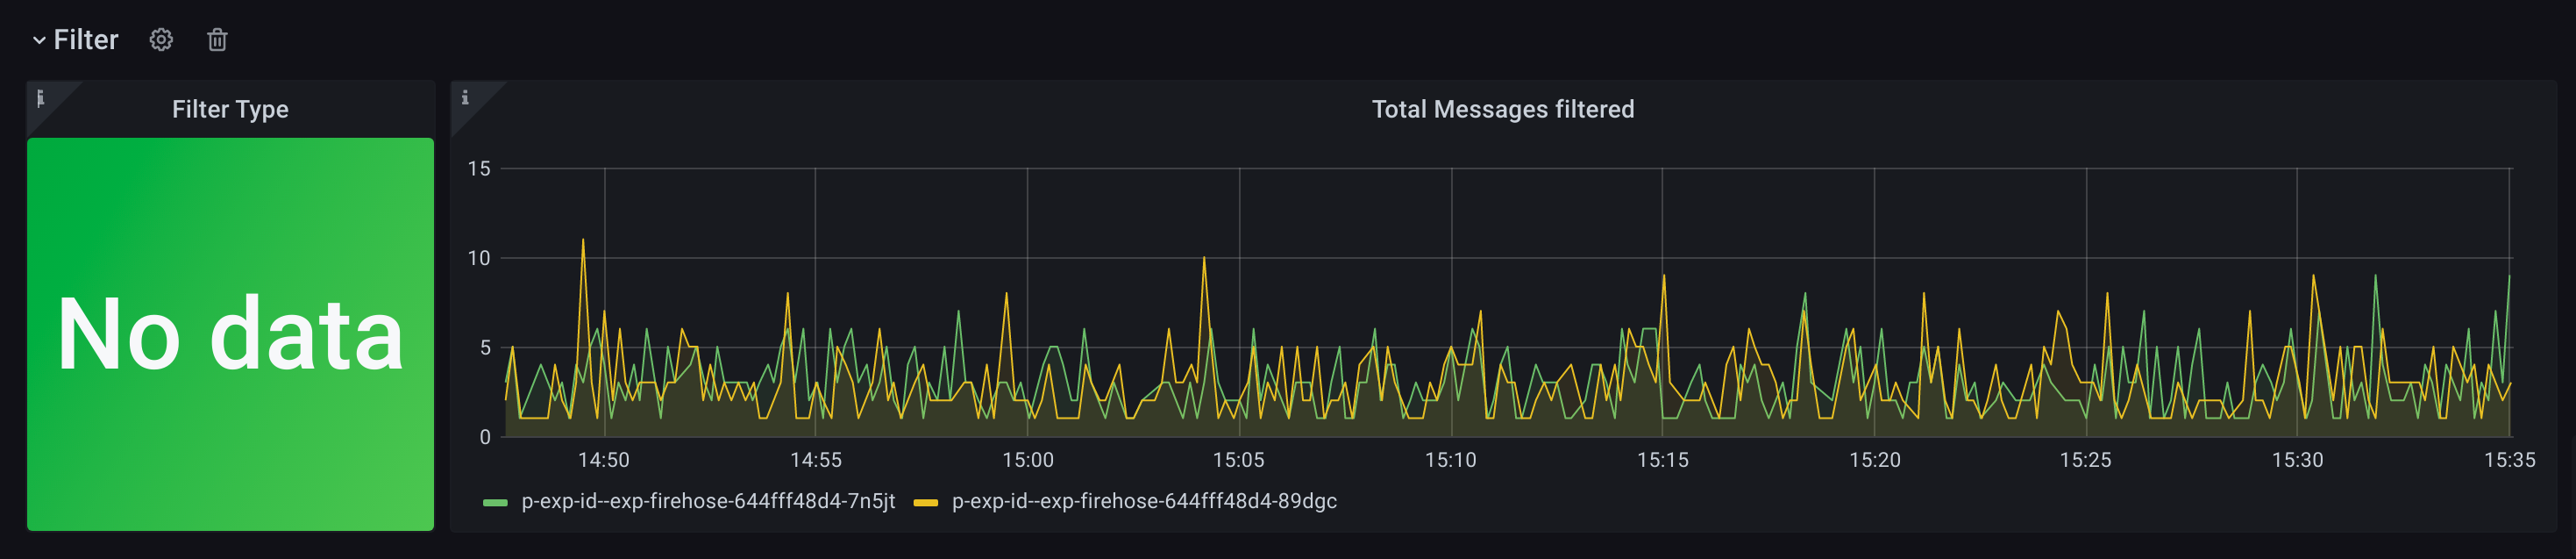
Filter